All recurring property costs
$8,400
Confirmed historical input
$700 per month × 12; includes taxes, insurance, utilities, routine maintenance and repairs, guest supplies, and other recurring property costs
Illustrative retrospective case study · Not an actual pre-purchase customer analysis, current appraisal, or guarantee
Property case study · Gulf Breeze, Florida
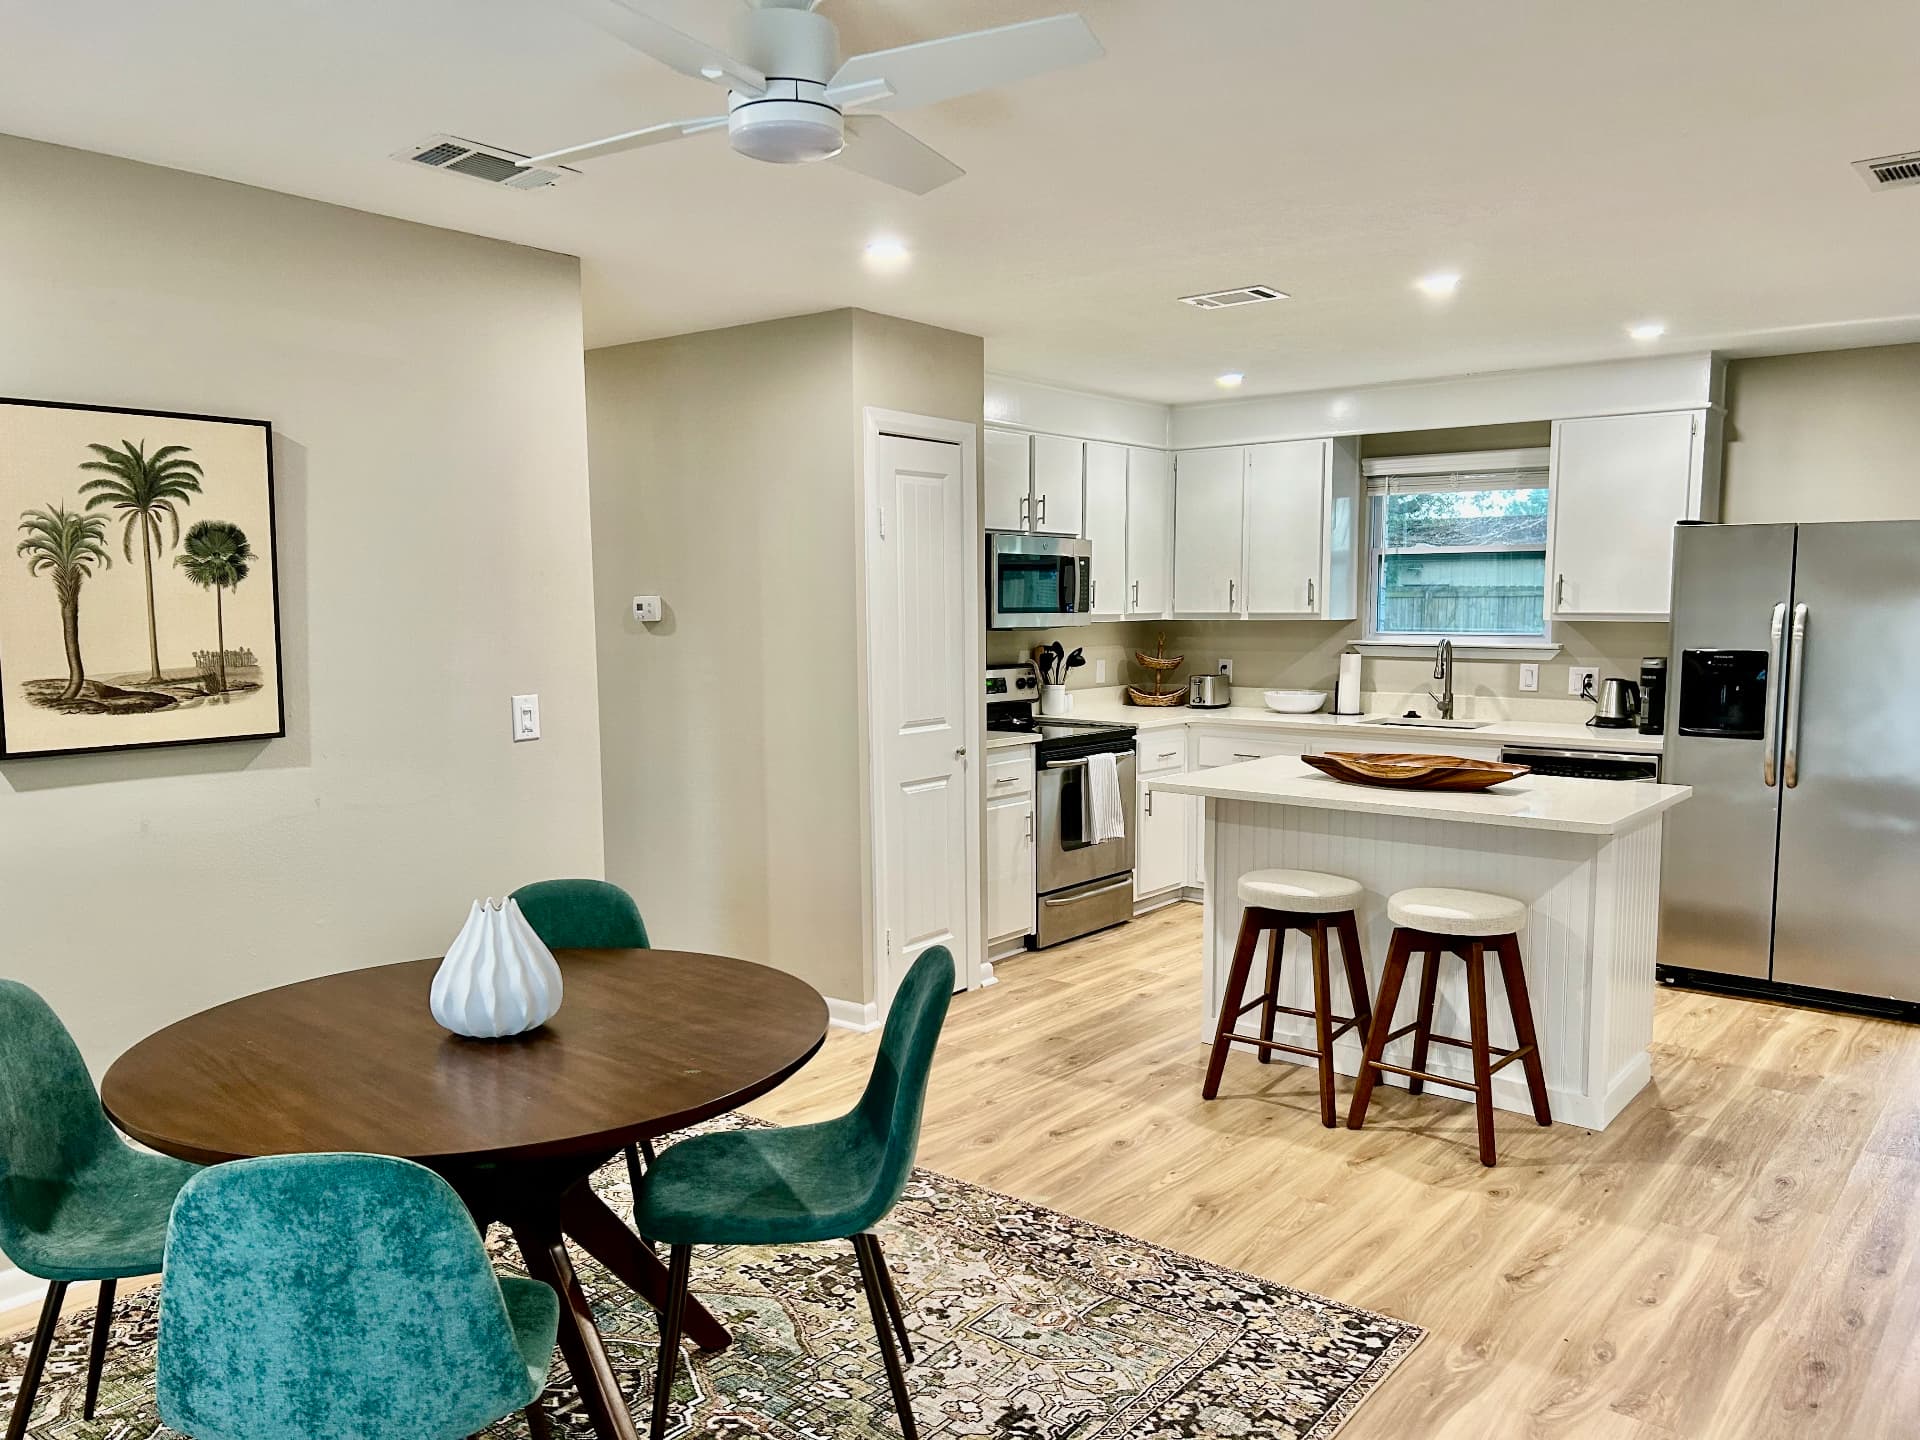
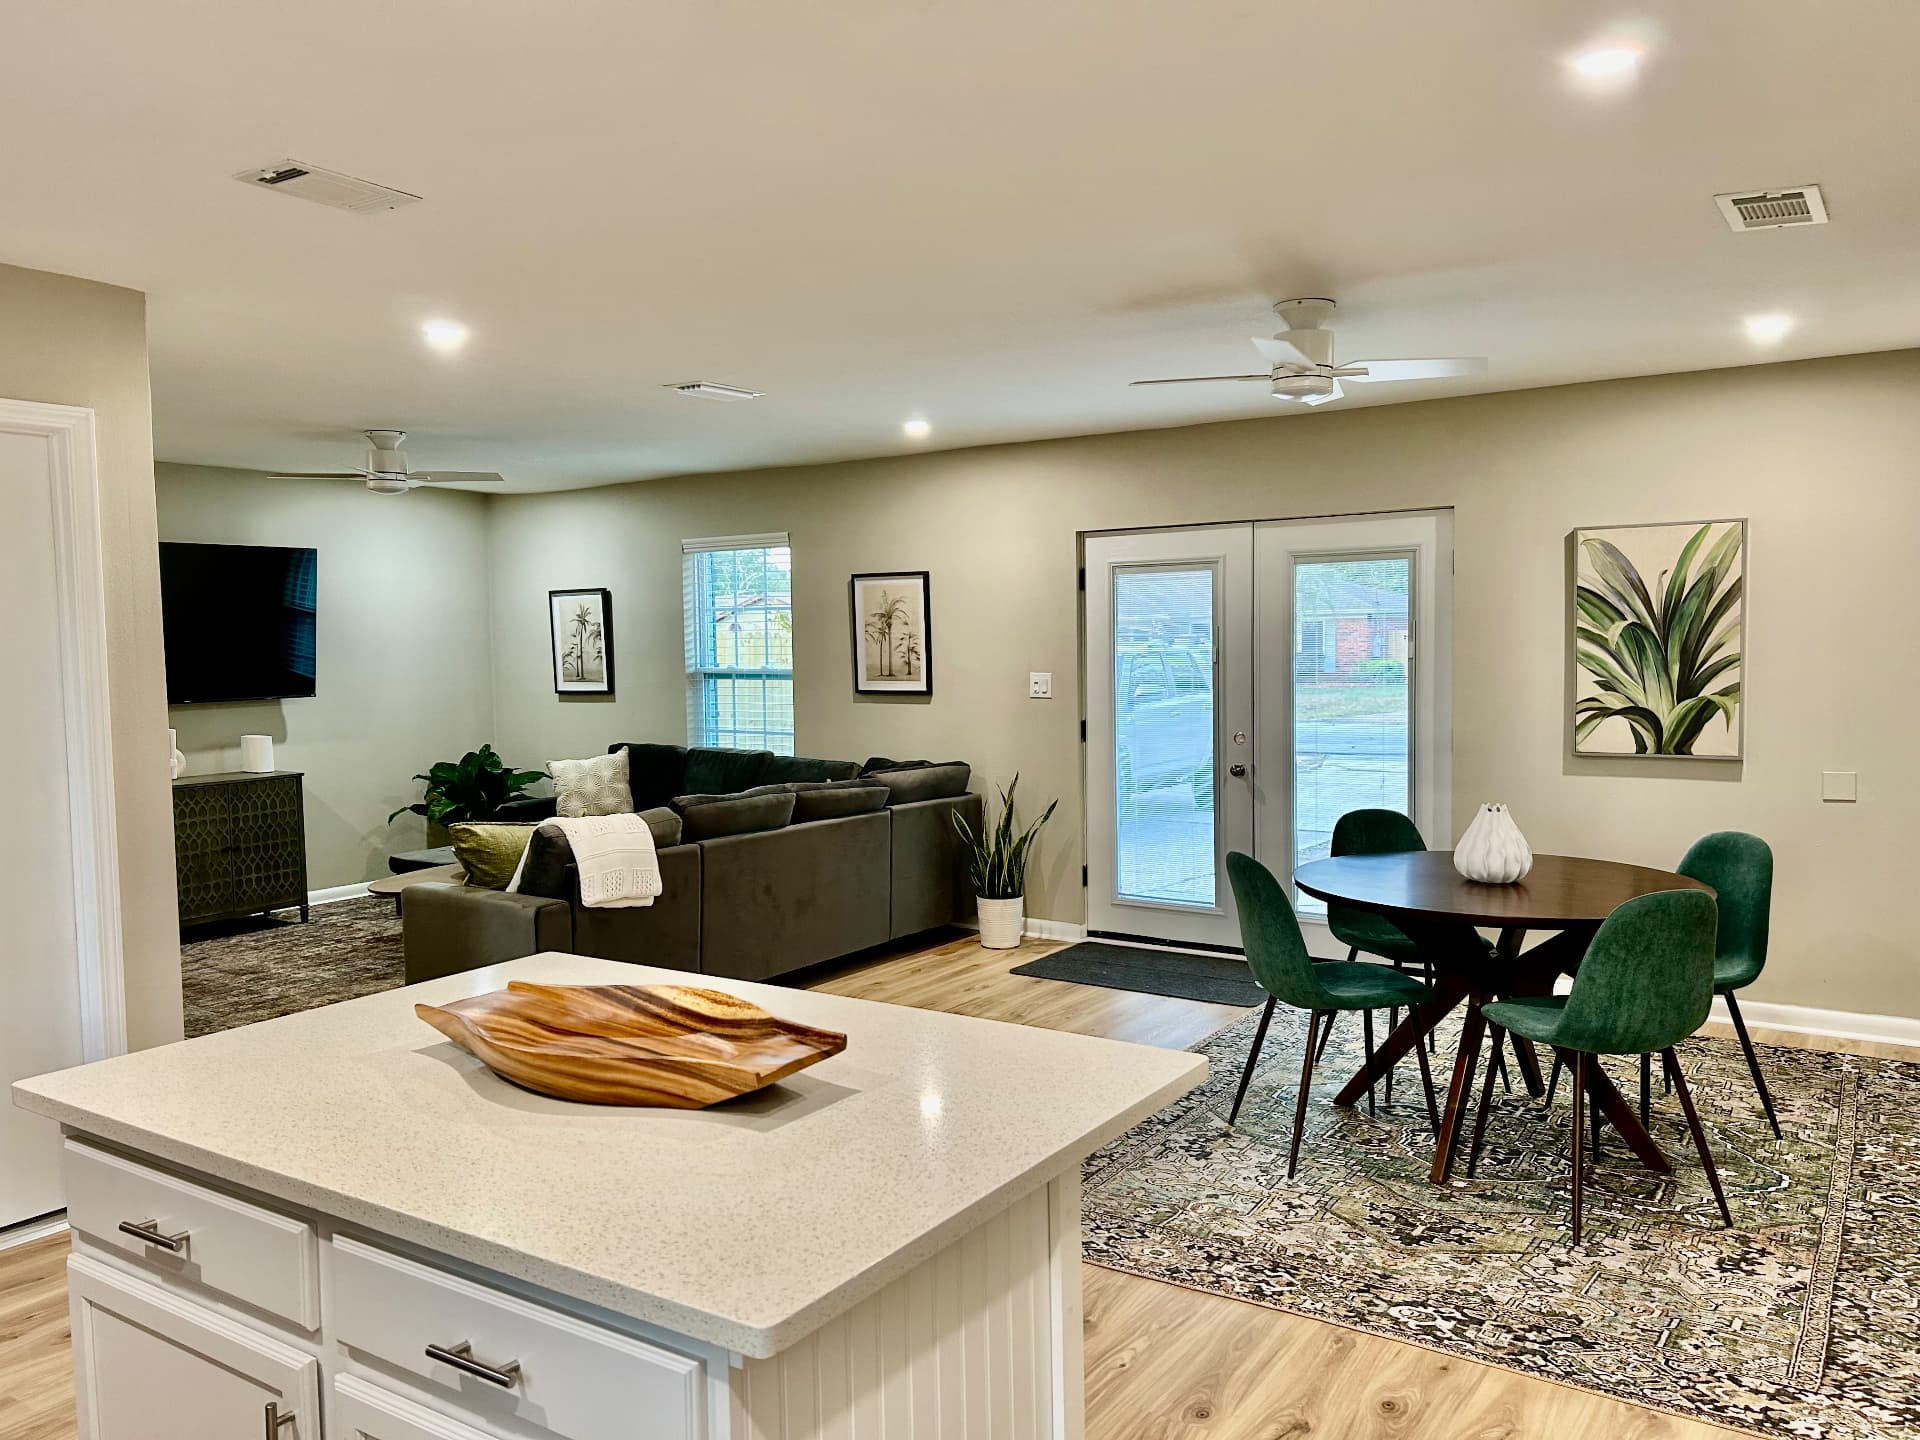
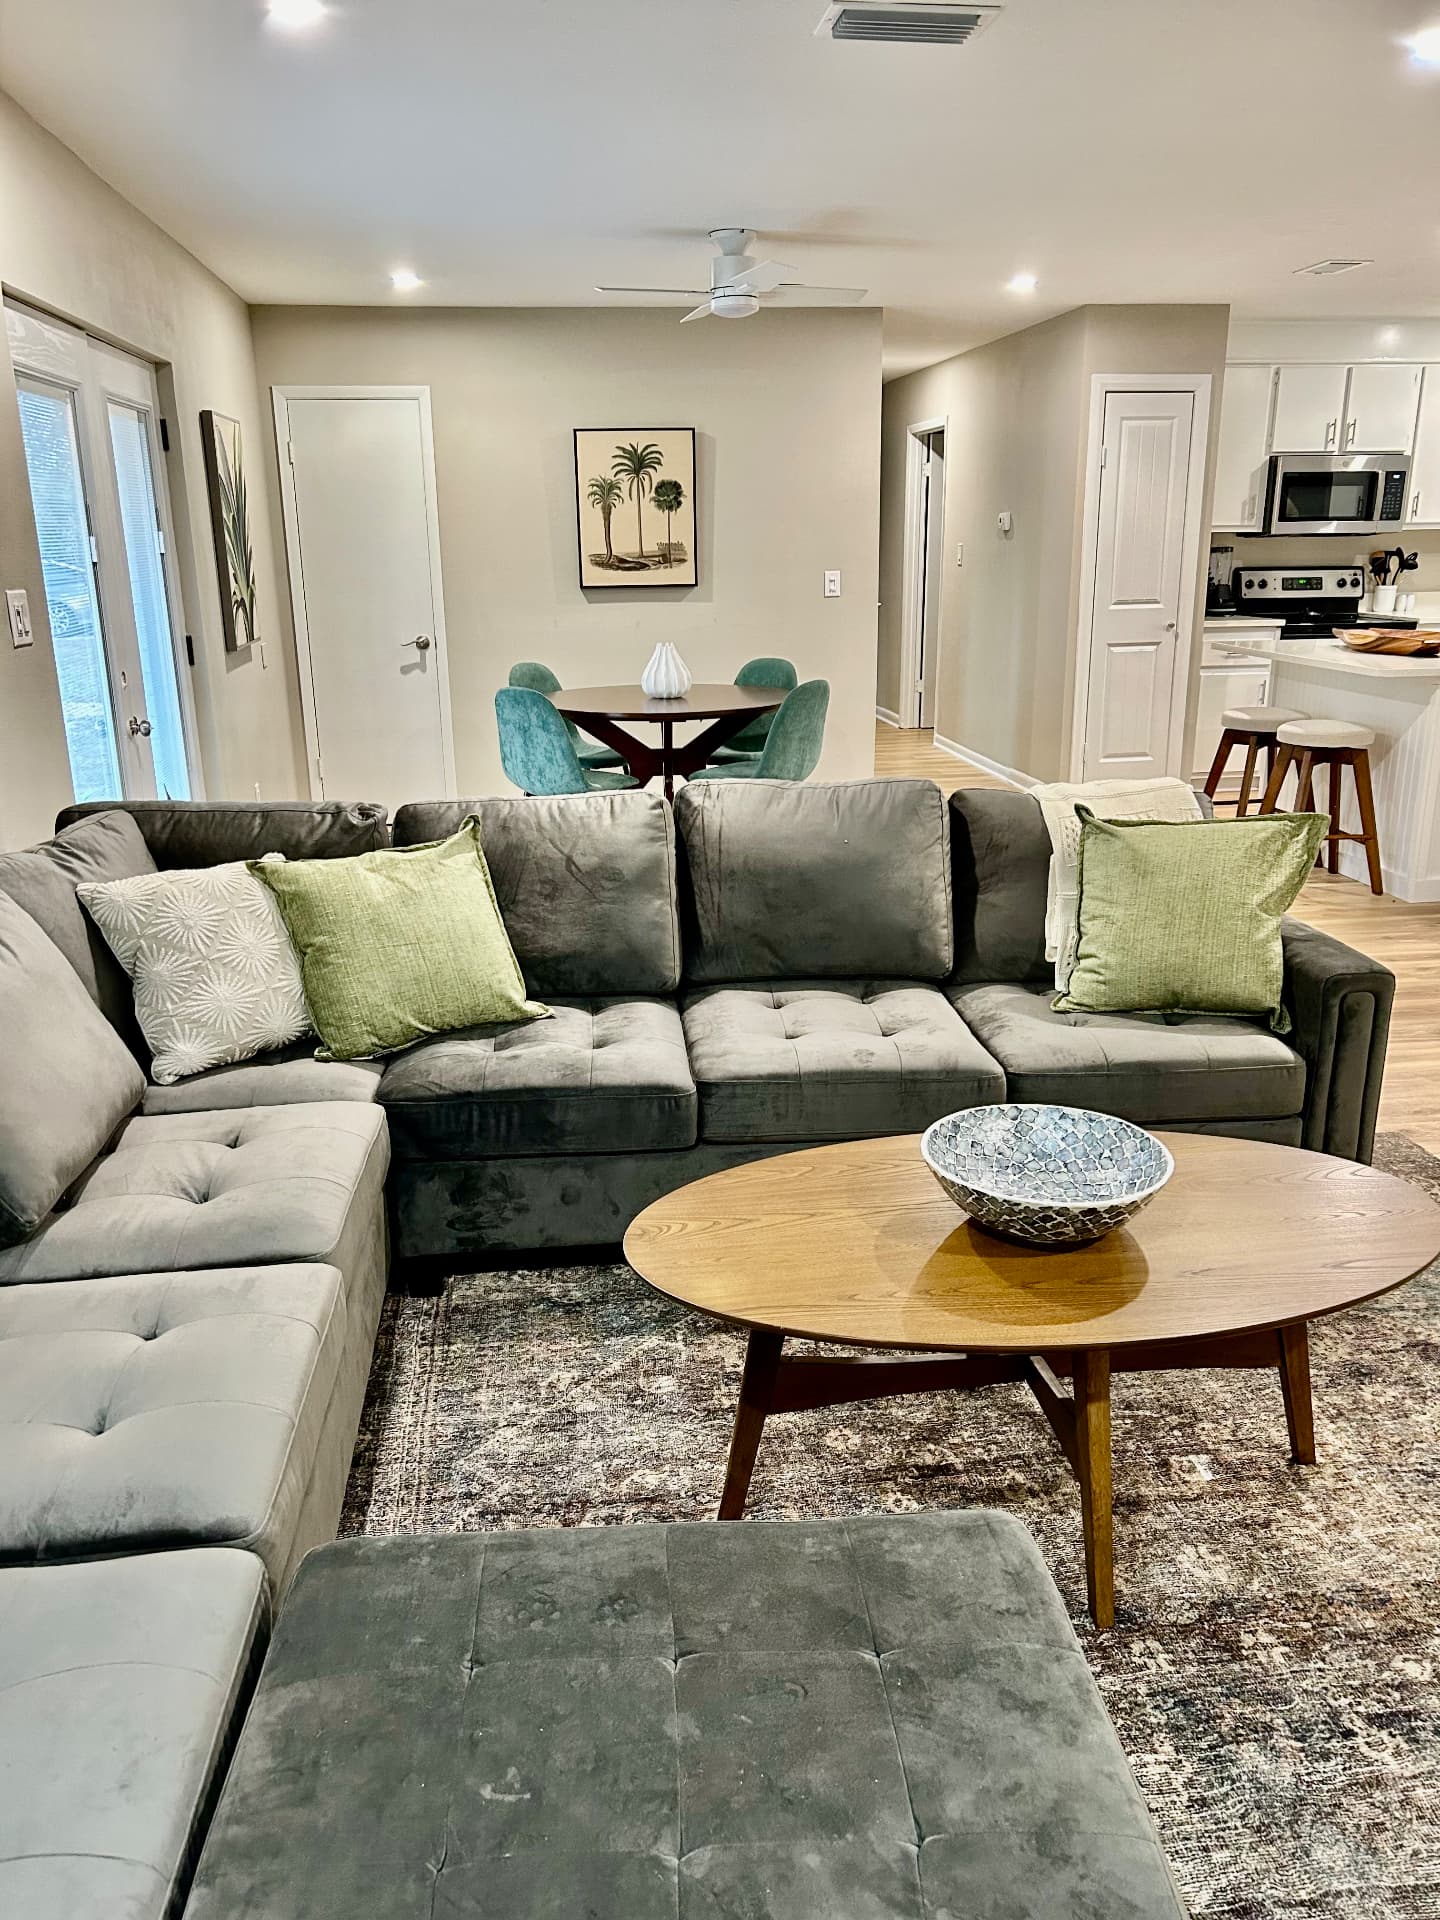
A self-managed, three-bedroom coastal rental with a documented operating history and a substantial post-purchase transformation.
01
Executive summary
Sea Le Vie is an approximately 1,200-square-foot, three-bedroom, two-bath vacation rental in Gulf Breeze. The property was acquired for $225,000 in cash and received $80,000 in combined renovation and furnishings, bringing known modeled capital to $305,000.
Its trailing 12 months produced approximately $48,000 in rental revenue at 70% occupancy. Guest-paid cleaning fees are separate from that revenue, and the property is self-managed.
On the expected illustrative case, the known operating inputs produce $38,160 in annual NOI and all-cash cash flow, equal to a 12.5% return on known modeled capital. This is an underwriting result—not verified historical profit.
Expected illustrative case
$38,160
Annual NOI and all-cash cash flow
02
Property snapshot
03
Historical operating performance
Gross rental revenue
~$48,000
Trailing 12 months; excludes guest-paid cleaning fees and is not net income.
Occupancy
70%
Supplied historical occupancy.
Implied nightly revenue
$188
$48,000 ÷ (365 × 70%). Not a verified ADR; cleaning fees are excluded.
Calculation
365 available nights × 70% occupancy = 255.5 implied occupied nights.
$48,000 trailing-12-month rental revenue ÷ 255.5 occupied nights = $188 implied nightly revenue.
This is a mathematical bridge between annual rental revenue and occupancy—not a platform-reported ADR. The confirmed $48,000 excludes guest-paid cleaning fees.
04
Revenue scenarios
Conservative
Total revenue including modeled cleaning fees
$53,575
Illustrative NOI
$31,176
Annual return
10.2%
15% below the documented trailing-12-month room revenue; includes $12,775 in modeled cleaning-fee revenue.
Expected
Total revenue including modeled cleaning fees
$60,775
Illustrative NOI
$38,160
Annual return
12.5%
Uses documented trailing-12-month room revenue as the illustrative baseline; includes $12,775 in modeled cleaning-fee revenue.
Upside
Total revenue including modeled cleaning fees
$67,975
Illustrative NOI
$45,144
Annual return
14.8%
15% above the documented trailing-12-month room revenue; includes $12,775 in modeled cleaning-fee revenue.
This sensitivity range moves rental revenue ±15% around the documented baseline. Each case adds and offsets the same modeled cleaning fees, deducts the $8,400 recurring-cost total, and applies the illustrative 3% platform fee to rental revenue. It is not a market forecast.
05
Operating assumptions
$8,400
$700 per month × 12; includes taxes, insurance, utilities, routine maintenance and repairs, guest supplies, and other recurring property costs
$12,775
255.5 occupied nights ÷ 3-night assumed stay × confirmed $150 per stay
$1,440
Illustrative 3% of $48,000 rental revenue; paid separately from the $8,400 total and subject to verification of the actual blended rate
$0
Self-managed; owner labor and time are not valued in this model
Total modeled annual operating expenses
$22,615
| Expense | Treatment | Basis | Annual |
|---|---|---|---|
| All recurring property costs | Confirmed historical input | $700 per month × 12; includes taxes, insurance, utilities, routine maintenance and repairs, guest supplies, and other recurring property costs | $8,400 |
| Cleaning service expense | Illustrative assumption | 255.5 occupied nights ÷ 3-night assumed stay × confirmed $150 per stay | $12,775 |
| Platform fees | Illustrative assumption | Illustrative 3% of $48,000 rental revenue; paid separately from the $8,400 total and subject to verification of the actual blended rate | $1,440 |
| Third-party management | Confirmed historical input | Self-managed; owner labor and time are not valued in this model | $0 |
| Total modeled annual operating expenses | $22,615 | ||
Cleaning model
Guests pay a separate $150 cleaning fee and cleaning service costs $150 per stay. The model assumes a 3-night average stay: 255.5 occupied nights ÷ 3 = about 85.2 stays; 85.2 × $150 = $12,775.
The model shows $12,775 of cleaning-fee revenue and an equal $12,775 expense. They offset exactly. Actual stay count and annual cleaning-fee totals have not been verified.
Confirmed expense treatment
The owner-confirmed $8,400 includes taxes, insurance, utilities, routine maintenance and repairs, guest supplies, and other recurring property costs. These categories are not added again. Platform fees are paid separately and modeled provisionally at 3% of rental revenue until the actual blended rate is verified.
06
All-cash acquisition analysis
Total modeled revenue
$60,775
$48,000 rental revenue + $12,775 cleaning fees.
Modeled expenses
$22,615
Includes equal cleaning expense and an illustrative 3% platform fee.
Illustrative NOI / cash flow
$38,160
Not verified historical profit; all-cash model with no debt service.
Illustrative return
12.5%
$38,160 ÷ $305,000; not a guaranteed buyer outcome.
The return uses the illustrative three-night average stay and 3% platform-fee rate. Modeled cleaning revenue and expense offset; the result is not verified historical profit.
07
Strengths, risks & opportunities
08
Operator review
Capital basis
Sea Le Vie required $80,000 in combined renovation and furnishings after its $225,000 cash purchase. That lifts known invested capital to $305,000 before undocumented closing or other costs and materially changes the return denominator. No unsupported allocation of that $80,000 is assumed.
Turnover economics
Guests pay $150 per stay and the cleaning service costs $150. Under the illustrative three-night stay assumption, both sides total about $12,775 and offset exactly. Actual stay count and annual cleaning totals remain to be verified.
Management model
Sea Le Vie carries no third-party management fee because the owner operates it directly. The model does not assign a value to owner labor. A buyer who will not self-manage should price professional management before treating the illustrative return as transferable.
09
Intended use & buyer diligence
Verification required
This case study does not establish legal approval for Sea Le Vie, a future buyer, or another property. Before purchase, independently confirm each item below with the relevant authority and qualified advisors.
10
Final operator perspective
Evidence-positive, diligence-dependent.
Sea Le Vie's documented record combines approximately $48,000 in trailing-12-month rental revenue, 70% occupancy, a self-managed operating model, and a $305,000 known capital basis after renovation and furnishings.
The expected illustrative case produces $38,160 in NOI and all-cash cash flow, or 12.5% on known capital. That result is strongest as a measure of this owner-operated history—not as a promise that another buyer can reproduce it. Self-management, stay length, platform fees, and the completeness of the known capital basis remain material.
For a current decision, the next step is to verify current market evidence, the actual blended platform-fee rate, source statements, regulatory eligibility, and the cost of the buyer's intended management plan. The modeled NOI is not verified historical profit or a guaranteed outcome.
11
Buyer verification checklist
Verify actual annual stay count and cleaning-fee revenue and expense totals.
Confirm occupancy and ADR from source-platform statements.
Review at least 12 months of category-level operating expenses.
Verify the actual blended Airbnb/Vrbo platform-fee rate against the illustrative 3% assumption.
Document average stay length and annual turnover count.
Price professional management if the buyer will not self-manage.
Build a current property-specific comparable set and seasonality view.
Verify intended-use eligibility with every applicable authority.
Add closing costs and all omitted initial cash to the return denominator.
Stress-test downside revenue and unexpected maintenance before purchase.
12
Your property
The $249 Full STR Acquisition Analysis applies this structure to your submitted property using available market evidence, visible assumptions, financial modeling, risks, diligence questions, and an operator-reviewed assessment.
This is a retrospective, illustrative acquisition analysis using confirmed historical inputs and explicitly identified modeling assumptions. It was not prepared before Sea Le Vie was purchased, is not an actual customer report or current appraisal, and does not guarantee future revenue, profit, return, or regulatory approval.
Go Far STR Intelligence provides informational analysis and revenue projections only. Projections are estimates based on available information and assumptions and are not guarantees of future revenue or investment performance. This service does not constitute financial, tax, legal, lending or investment advice. Customers should independently verify zoning, permitting, HOA restrictions, insurance requirements, financing requirements and local short-term rental regulations before purchasing or operating a property.